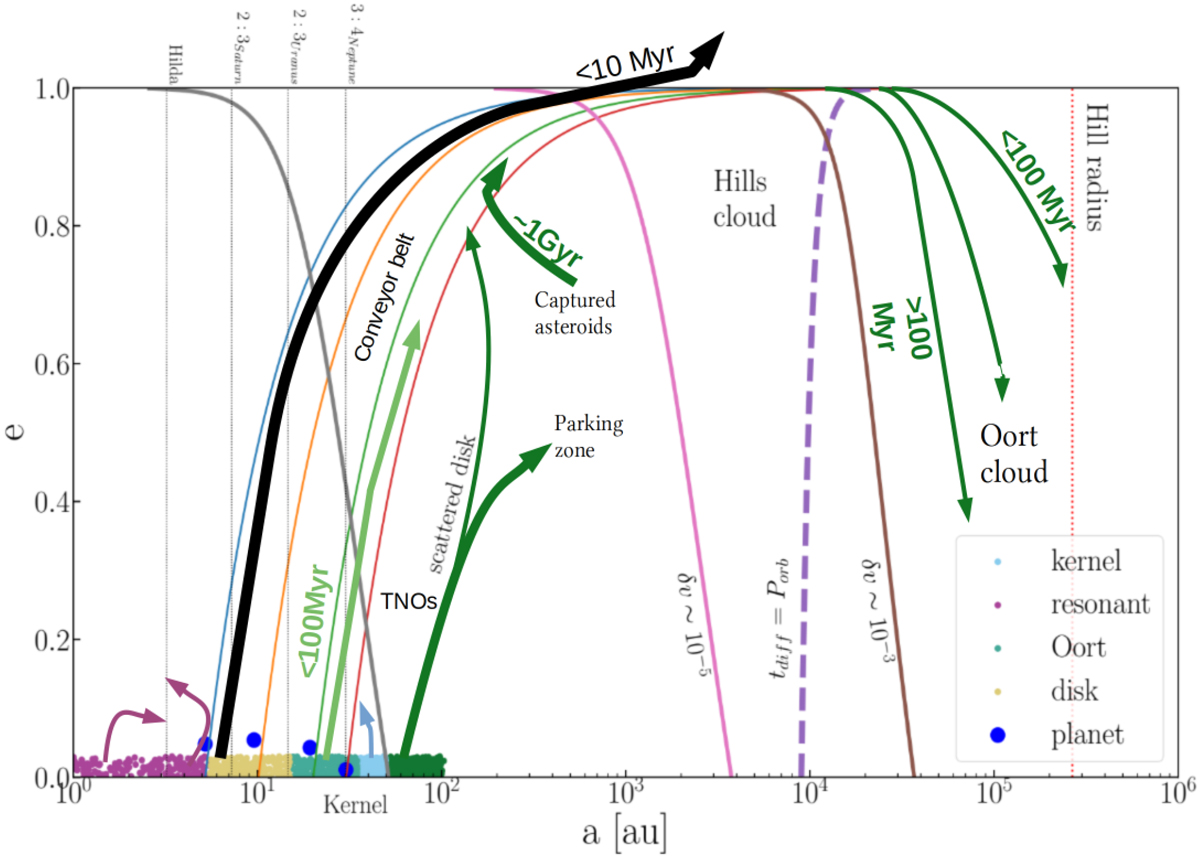
Fig. 1 Orbital migration of asteroids and how they end-up in the Oort cloud. The four major planets are indicated with their current semi-major axis and eccentricity as blue dots. The initial circumstellar disk is presented in five colors, depending on the final destination of the asteroids populating the different disk sections. The arrows indicate the movement of asteroids originating from the disk or captured from other stars. The timescales presented near the arrows give an estimate of the timescale of migration. The colors indicated in the legend give the original inner disk (magenta), which mainly migrates away from resonant orbits (Delbo’ et al. 2017) (four important resonances are indicated with thin vertical dotted lines). Ochre indicates those asteroids that are ejected from the Solar System on a relatively short timescale (.10 Myr). Light blue indicates the kernel and the resonant Kuiper belt. The light green and dark green curves show the migration patterns of the asteroids that eventually reach the Oort cloud.
These objects migrate from a semi-major axis of a few tens of au to beyond 104 au through a narrow neck of high eccentricity. The asteroids in the dark green area require external support from a stellar encounter to be able to migrate to the Oort cloud.
We note that the closer an asteroid is to the Hill radius (vertical red dotted line to the right), the quicker its orbit will be circularized by the Galactic tidal field. The gray, pink, and brown curves indicate where the relative velocity kick imparted at apocenter by the Galactic tidal field to an asteroid is δv=10-8, 10-5, and 10-3 of the orbital velocity, respectively. The purple dashed curve indicates the orbital separation and eccentricity for which the tidal eccentricity damping timescale is equal to the orbital period (see Duncan et al. 1987).
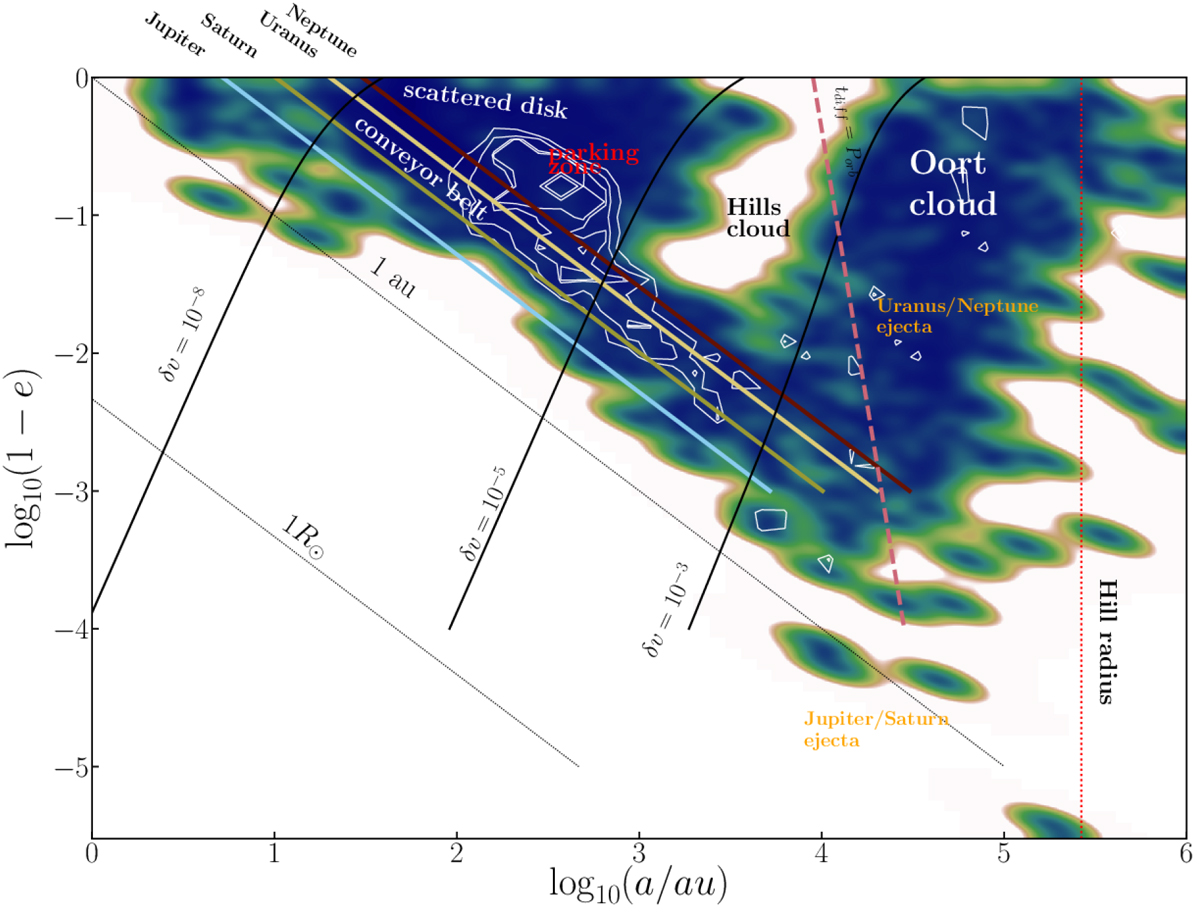
Fig. 2 Phase-space distribution of asteroids around the Sun ∼100 Myr after escape from its parent cluster. The shaded region presents a kernel-density estimation of the simulation results, representing various families of objects. We adopted a non-parametric Gaussian kernel density estimator with a symmetric bandwidth of 0.02 (Scott 1992). At this moment, part of the Oort cloud is already in place (to the right), but the formation process is still ongoing. The colored diagonal curves (from top left to bottom right) indicate orbits that cross those of the giant planets (see also Fig. 1).
The dashed burgundy colored curve to the right indicates where the orbital period, Porb, is equal to the eccentricity damping- diffusion timescale by the Galactic tidal field (Eq. (5) of Duncan et al. 1987). The solid black curves indicate the Galaxy’s perturbing influence in terms of the velocity-kick imparted to an object. Relative velocity perturbations of δv = 10-3 (right), 10-5, and 10-8 (left) are indicated. The little area to the right of Neptune’s influence (between the red diagonal curve and the black curve indicating a perturbation δv=10-8) corresponds to the Kuiper-belt kernel distribution. The parking zone is indicated in red. The Oort cloud is to the right of the rightmost solid black curve (labeled as δv=10-3) and the burgundy colored dashed curve. The Hills cloud is to the left of this dividing line (indicated in black). In our simulations, the Hills cloud at low eccentricity (e ≤ 0.95) is mostly empty, but at higher eccentricity (near the bottom of the figure) its population is substantial, in particular along the conveyor belt.
The captured and scattered asteroids are indicated in white contours. Locally, at the extreme, both populations have comparable phase-space density. At the age of 100 Myr, a considerable fraction of the native disk population has already reached the Oort cloud, or is on its way there through the conveyor belt. Some captured asteroids are currently migrating along the conveyor belt and a few have already reached the Oort cloud. However, the majority of the scattered and captured asteroids are in the parking zone between ∼100 au and ∼1000 au, where they will stay for the duration of the simulation.
Jupiter and Saturn eject asteroids along the conveyor belt into escaping orbits (indicated in orange). Uranus and Neptune eject asteroids on a timescale considerably longer (≥100 Myr) than that for Jupiter and Saturn (≤10 Myr), allowing these asteroids to be circularized by the Galactic tidal field (also in orange). This is also visible in the lower kernel density along the Jupiter–Saturn conveyor belt in comparison with the Uranus–Neptune conveyor belt. Eventually, the latter asteroids become members of the Oort cloud (Fig. 3). The red dotted curve indicates the Hill radius of the Sun in orbit around the Galactic center, here at about 0.65 pc. The thin dotted diagonal curves indicate pericenter distances of 1au and 1R⊙. Comets from the Oort cloud may enter the inner Solar System (to the far bottom right and below the 1 au curve).
Fig. 3 Semi-major axis as a function of eccentricity for Kuiper belt-like objects. The grey shaded areas represent the different regions of the solar system (Kuiper belt (KB), scatter disk (SD), Sednoids), while the dashed lines indicate the mean motion resonance of the particles with Neptune. The integration time is set to 100 Myr. The simulation shows the dynamical evolution and interaction of comets with the Giant planets.